


After a 6-month break we were excited for our June 2023 session return for Power BI 4 Enviro's. This was a joint presentation between DiscoverEI and Alluvium, who supported South East Water (SEW), in developing a Power BI Environmental Sensitivity Mapping (ESM) report, to help SEW identify key sensitivities of both environmental and public health across their region, to help inform risk assessments and incident response.
Read More
For our December 2022 session, we were lucky to have Matt Allington (Microsoft MVP Data Platform - Sydney, Australia) joining us again to share his Power BI report presenting streamflow data from the most recent October floods that impacted much of Australia. Matt has been posting daily updates about impacts to the Big Bend region through his YouTube channel, which you can keep up-to-date with on his YouTube channel (Excelerator BI YouTube)
Our thoughts remain with anyone that has been or is being impacted by these devastating floods, especially those within our meetup community❤️ !
Read More
This video is part of DiscoverEI's DAX for Enviro's series, and walks through an example of how to use Power BI for water resource management. We show you how to make a scenario analysis tool using Power BI What If parameters.
Read More
This video is part of DiscoverEI's DAX for Enviro's series, and walks through an example of how to use Power BI for water resource management. We show how to calculate the likelihood of different dam storage volumes occurring by analysing 120 different modelling scenarios in Power BI using the DAX iterator PERCENTILEX.
Read More
This video is part of DiscoverEI's DAX for Enviro's series, and walks through an example of how to use Power BI for water resource management. We show how to analyse total system dam storage volumes across 120 different modelling scenarios in Power BI using the DAX iterators: AVERAGEX, MINX and MAXX. We take it to the next level by configuring error bands for the minimum and maximum storage outlook volumes to show the range of possible scenarios.
Read More
For our November 2022 session, it was all about DAX, and more specifically DAX for Enviro's using environmental dataset examples. Alice ran through some common DAX patterns for a range of environmental applications such as, and then Greg Nash and Sam Fischer supported a robust Q&A on DAX.
Read More
This video is part of DiscoverEI's DAX for Enviro's series, and walks through how to calculate long-term averages and moving averages for daily rainfall data using DAX in Power BI. We explore the CALCULATE, ALL, ALLSELECTED and DATESBETWEEN DAX functions, and take it to the next level by creating a dynamic moving average analysis using What If parameters.
Read More
This video blog is part of DiscoverEI's DAX for Enviro's series, and shows how to calculate your cumulative groundwater usage in Power BI using TOTALYTD, and create a DAX measure to compare against remaining groundwater licence entitlement volume.
Read More
This video blog is part of DiscoverEI's DAX for Enviro's series, and shows how to calculate species richness and abundance in Power BI using the DAX functions SUM and DISTINCTCOUNT.
Read More
This video is the first of DiscoverEI's DAX for Enviro's series, and provides an overview into what is DAX, and how to get started creating calculated columns and measures. Alice also shares some of her favourite resources for where you can go to learn more about DAX.
Read More
For our October 2022 session, we had Michael Crothers from Wannon Water presenting on the Data Analysis & Reporting Scope Considerations Framework he has been developing for Power BI report creators. Michael shared elements of the framework, how it is being applied along with Power BI examples.
Read More
For our September 2022 session, we were excited to have Dr. Petina Pert from CSIRO, presenting alongside Alice Drummond and Daniel Marsh-Patrick from DiscoverEI on the Great Barrier Reef SELTMP Power BI Dashboards: https://research.csiro.au/seltmp/explore-dashboards-here/
Read More
For our August 2022 session, we had the pleasure of having Belinda Walters (Communications Lead - Greater Melbourne Urban Water & System Strategy) and DiscoverEI’s very own Alice Drummond (co-founder DiscoverEI) present on the Water for Life strategy Power BI report: https://waterforlifestrategy.com.au/
Read More
For our July 2022 session, we had the pleasure of having Will Thompson (Microsoft Power BI Program Manager) present on the recent demo Power BI report from the Gartner Bake-Off Summit. You can also see Will's demo at the Gartner Bake-Off summit here: https://www.youtube.com/watch?v=gGjJ-dY01NA
Read More
For our June 2022 session Shannon Lindsay shared a recent Workout Wednesday challenge, where we created a custom theme in Power BI, in an effort to build a report exploring the UN Sustainable Development Goals. This session covered the creation of a custom theme, the use of images and icons, and tips and tricks to customize your Power BI reports.
Read More
For our April 2022 Power BI 4 Enviro’s session, we had Matt Allington (Australian Microsoft MVP) presenting on his rainwater tank Power BI report. If you want to be good at Power BI, you must get practice. That doesn’t mean you have to practice at work. You can also get practice in at home. In this session, Matt stepped through a process of creating a Power BI report from scratch to determine what size rain water tank is needed for a new property/house.
Read More
In this session, Pragati took us through her Global carbon dioxide emissions public data Power BI report, and how she generated a quick report keeping in mind what insights can be derived from this data. Her version of the report for your interest is available here: https://community.powerbi.com/t5/Data-Stories-Gallery/Global-CO2-Emissions-Analysis/td-p/2313590
Read More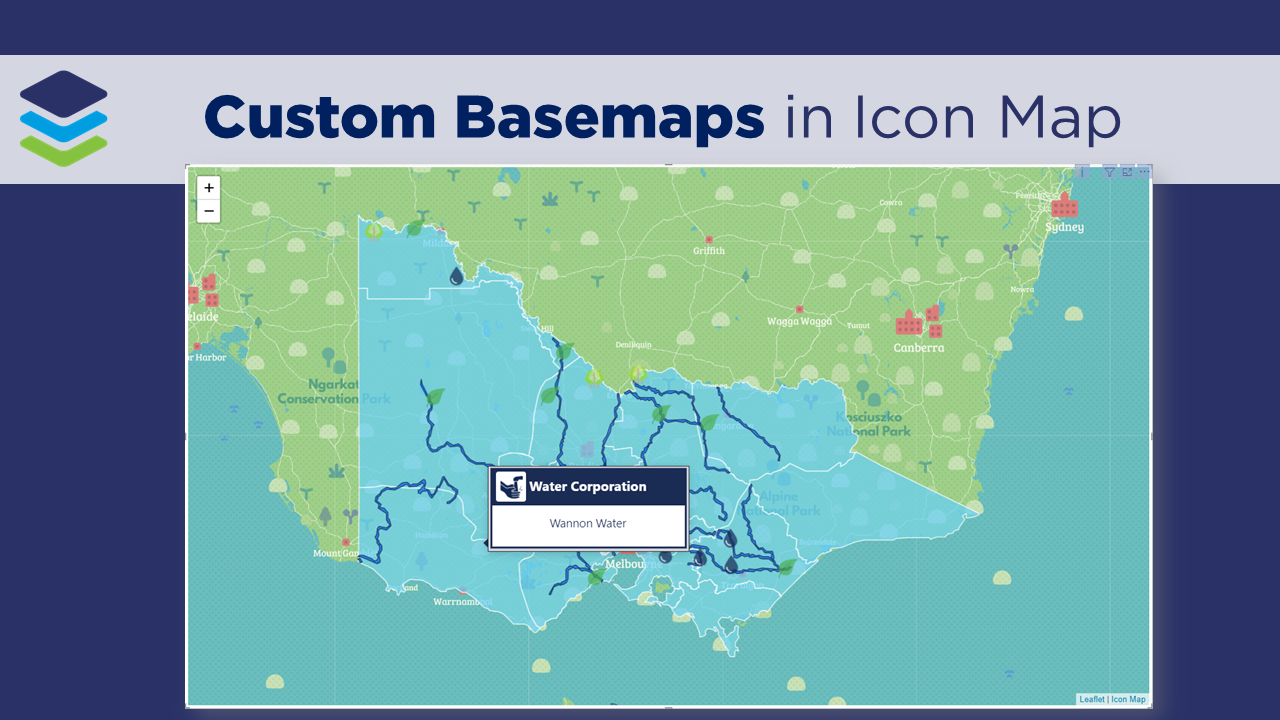
In this short video blog we walk through how to create custom basemaps in MapBox and integrate them into your Icon Map in Power BI! We then take it to the next level by configuring dynamic basemaps which we can change using slicers. A big shoutout and thanks to James Dales for creating this awesome visual!!
Read More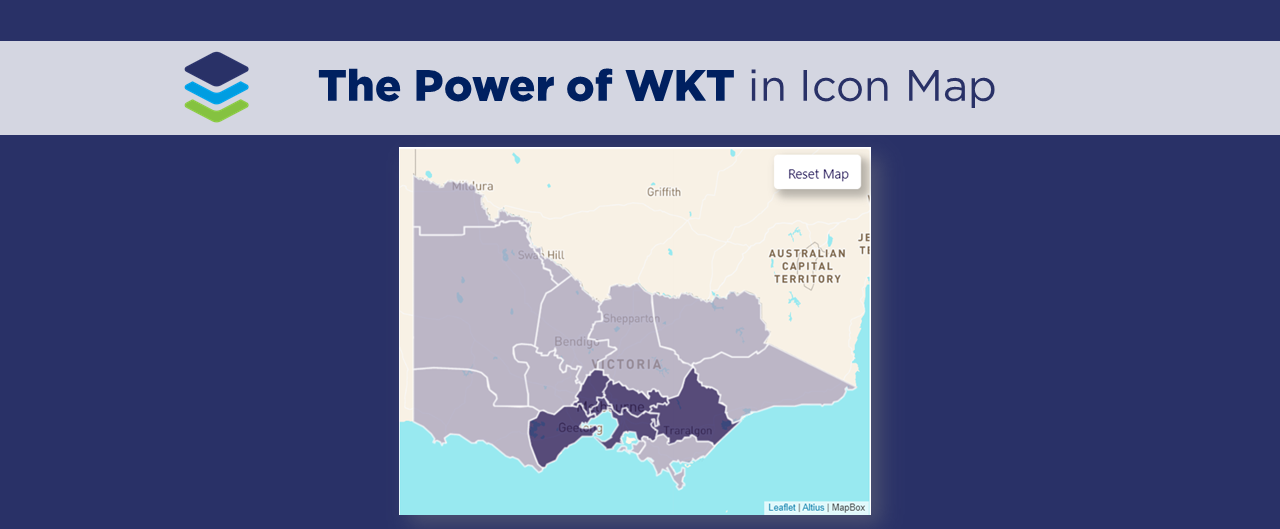
In this short video blog we walk through how to take Icon Map to the next level by incorporating WKT to plot custom points, lines and polygons, including a quick overview of how to convert your spatial files to WKT in QGIS. A big shoutout and thanks to James Dales for creating this awesome visual!!
Read More
Icon Map is hands down my favourite mapping visual for Power BI! In this short video I walk through how to get started creating your very first map with custom icons. A big shoutout and thanks to James Dales for creating this awesome visual!!
Read More